 Seven Management Tools Figure 1" width="469" height="124" />
 Seven Management Tools Figure 1" width="469" height="124" />

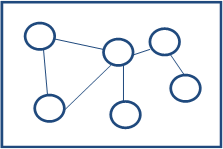
Relationship Diagram: Otherwise also called as Interrelationship diagram. It is used to signify the strength of relationship between two processes or entities. It helps us to understand the causal relationship between variables/processes in a complex scenario. It establishes the linkages between variables/processes. The number of incoming and outgoing links indicates the importance of each process. The higher number of incoming arrows indicates the higher dependency of that process on other processes. Similarly, the more number of outgoing arrows from a particular process indicates the importance of that process on other dependent processes.
 Seven Management Tools Figure 2" width="223" height="149" />
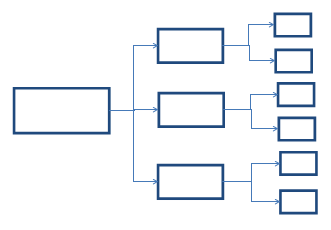
Tree Diagram: This helps in understanding the process level-by-level by breaking down complex processes to the minute level of detail. It helps the team move down from broad process map to specific process details and requirements. It brings down and explores the finer details in any complex process. This is very helpful in decision making in a complex process with many business rules or in process that have huge financial implications.
 Seven Management Tools Figure 3" width="331" height="230" />
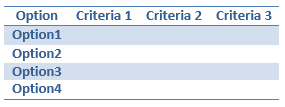
Prioritization Matrix: This is a tool that helps in prioritizing an option over others, given a set of decision making criteria. Options and criteria are arranged in Row-Column format. Weightages are assigned to each criteria and user has to rate each option on all the criteria. Based on the rankings, the option that has the highest rating collectively on all criteria is chosen.
 Seven Management Tools Table 1" width="285" height="107" />
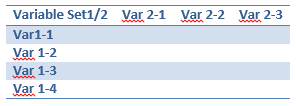
Matrix Diagram: This is another tool that helps in establishing relationship between variables. Variables are arranged in both Row & column and the strength of the relationship between each pair is marked in their corresponding cell. We can use this to measure relationship for one (Triangle), two (L shape), three (T shape, Y shape, C shape) and four set (X shape) of variables.
 Seven Management Tools Table 2" width="296" height="106" />
Process Decision Program Chart (PDPC): This tool is based on the Decision tree but has other additional features like mapping the failure mode, risk involved, effect of failure with each decision node. It combines the aspects of FMEA – Failure mode, effect and risk of failure with the Decision tree. Thus it helps us to analyze all possible problems involved in making a decision. Thus, a corrective/preventive action can be planned for any step in the process.
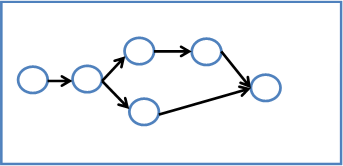
Activity Network Diagram (AND): This is also called as Arrow Diagram and is a tool used in PERT and by Project Management professionals to map their activities and sequential tasks in a visual format to understand and optimize the project duration. Plotting an AND makes you find the project duration, schedule tasks easily and identify the critical path.
 Seven Management Tools Figure 4" width="343" height="166" />